Multiple Choice
Identify the
choice that best completes the statement or answers the question.
|
|
|
1.
|
Organize the following data using a stem-and-leaf
plot.
13, 2, 35, 5, 16, 39, 42, 7, 33, 25, 3, 14, 47
|
|
|
2.
|
If the following set of weights for members of a
wrestling team is organized using a stem-and-leaf plot, how many leaves accompany the stem
“15”?
165, 113, 91, 134, 145, 105, 119, 137, 138, 108, 129, 122, 98, 117,
141
|
|
|
3.
|
If the following numbers are organized using a
stem-and-leaf plot, how many stems contain 2 leaves?
13, 2, 35, 6, 17, 39, 41, 8, 31, 23, 4,
14, 48
|
|
|
4.
|
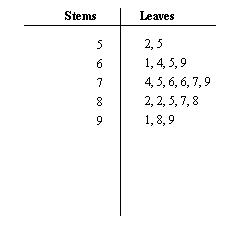
The following stem-and-leaf plot was used to
organize a group of test scores. How many students had a test score less than 60 or greater
than 80?
|
|
|
5.
|
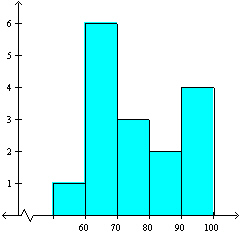
Sixteen distinguished university professors were
recently asked how many papers they had written which were later published in scholarly
journals. The results are organized below in a histogram. How many of the professors have
published less than 80 papers throughout their career?
|
|
|
6.
|
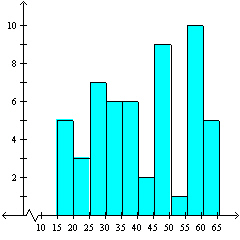
The ages of the employees at a certain company are
organized below in a histogram. How many of the employees were under the age of 30 fifteen
years ago?
|
|
|
7.
|
Find the mean of the following set of
measurements.
5, 1, 10, 14, 9, 21, 17, 10
a. | 10 | d. | 8.465 | b. | 11.705 | e. | 10.875 | c. | 87 |
|
|
|
8.
|
Find the mode of the following set of
measurements.
5, 2, 11, 11, 2, 5, 2, 5
|
|
|
9.
|
A certain restaurant hosted a series of birthday
parties throughout the month. If the number of attendees at each party is listed below, find
the variance of the data
set.
128
78
86
52
102
119
53
125
a. | 820.109 | d. | 28.638 | b. | 849.949 | e. | 767.926 | c. | 92.875 |
|
|
|
10.
|
Eight students had the following test scores on a
math test.
73, 65, 90, 85, 95, 82, 79, 66
Find the variance of the set of
scores.
a. | 102.734 | d. | 79.375 | b. | 104.323 | e. | 10.136 | c. | 80.5 |
|
|
|
11.
|
The test scores for a certain biology class are
normally distributed with a mean score of 81 and a standard deviation of 8. Find the z-score
for a test score of 94, and round your answer to two decimal places.
a. | 1.50 | d. | 1.75 | b. | 1.06 | e. | 1.88 | c. | 1.63 |
|
|
|
12.
|
Employee salaries at a certain company are normally
distributed with a mean salary of $59,000 and a standard deviation of $7100. Find the z-score
for a salary of $70,400. Round your answer to two decimal places.
a. | 1.46 | d. | 1.61 | b. | 1.32 | e. | 1.07 | c. | 1.75 |
|
|
|
13.
|
Employee salaries at a certain company are normally
distributed with a mean salary of $59,000 and a standard deviation of $7700. Find the
probability that an employee chosen at random from the company has a salary less than
$49,760.00..
a. | 0.1587 | d. | 0.0808 | b. | 0.1357 | e. | 0.1151 | c. | 0.0968 |
|
|
|
14.
|
Find the correlation coefficient r for the
data given below.
(2, 7), (6, 3), (10, 4), (11, –1)
a. | –0.9078 | d. | –0.4078 | b. | –0.6117 | e. | –0.9539 | c. | –0.8156 |
|
|
|
15.
|
Find the sum of square differences between the data
below and the least squares regression parabola..
( , 2), ( , 2), ( ,
5), (0, 3), (1, 0) ,
5), (0, 3), (1, 0)
a. | 0.8 | d. | 2.76 | b. | 2.23 | e. | 1.6 | c. | 1.54 |
|
|
|
16.
|
Find the sum of square differences between the data
below and the least squares regression parabola..
( , –1), ( , –1), ( , –3), (0, –3), (1, 0) , –3), (0, –3), (1, 0)
a. | –0.53 | d. | 1.74 | b. | 0.4 | e. | 0.05 | c. | 0.78 |
|
|
|
17.
|
Find the least squares regression parabola for the
points.
( , 3), ( , 3), ( , 0), (0, 4),
(1, 0), (2, 1) , 0), (0, 4),
(1, 0), (2, 1)
|
|
|
18.
|
Find the sum of square differences between the data
below and the least squares regression parabola..
( , –2), ( , –2), ( , –5), (0, –6), (1, 0), (2, 4) , –5), (0, –6), (1, 0), (2, 4)
a. | 45.247 | d. | 48.83 | b. | 13.333 | e. | 44.038 | c. | 46.711 |
|
|
|
19.
|
A survey of newlyweds was recently conducted by a
magazine. The participants were asked to give the age of the bride and the number of guests at
their wedding. Some of the resulting data is shown below.
| Age of Bride, x | 18 | 20 | 23 | 27 | | Average Number of Wedding Guests, y | 99 | 146 | 184 | 130 | | | | | |
Use the least
squares regression line to estimate the average number of wedding guests for a bride of age
33.
a. | 173 guests | d. | 180
guests | b. | 178 guests | e. | 177
guests | c. | 175 guests |
|
|
|
20.
|
A company compiles data relating to the production
costs of a certain product. Assume the cost of manufacturing the product depends entirely upon
the number of items produced. Some of the data compiled by the company is shown
below.
| Number of Items Produced, x | 108 | 122 | 131 | 142 | | Production Cost (in Thousands of $’s), y | 92 | 105 | 117 | 129 | | | | | |
Find the least
squares regression line for the data.
a. | y = 1.039 -
25.58 -
25.58 | d. | y = 1.101 -
27.762 -
27.762 | b. | y = 1.101 -
25.58 -
25.58 | e. | y = 1.039 - 27.762 - 27.762 | c. | y = 1.101 -
26.426 -
26.426 |
|