Multiple Choice
Identify the
choice that best completes the statement or answers the question.
|
|
|
1.
|
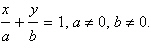
Find the slope and y-intercept (if possible)
of the equation of the line. Select the correct answer for the line.

|
|
|
2.
|
Find the slope of the line passing through the
given pair of points.
(0, 5), (6, 0)
|
|
|
3.
|
Find the slope-intercept form of the equation of
the line that passes through the given point and has the indicated slope m. Select correct
answer for the line.
(2.2, –8.6 ), 
|
|
|
4.
|
Use the intercept form to find the equation
of the line with the given intercepts. The intercept form of the equation of a line with intercepts
 and and  is is
Point on line: 
x-intercept: (c,
0)
y-intercept: (0, c), 
|
|
|
5.
|
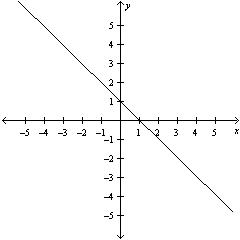
Estimate the slope of the line.
|
|
|
6.
|
A microchip manufacturer pays its assembly line
workers $15.25 per hour. In addition,
workers receive a piecework rate of $0.45 per unit produced.
Select a linear equation for the hourly wage W in terms of the number of units x
produced per hour.
|
|
|
7.
|
Evaluate  if if 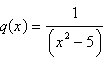 . .
|
|
|
8.
|
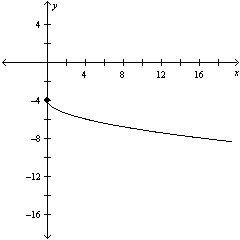
Find the domain of the function.

a. | Non-negative real numbers
x | b. | All real numbers x | c. | All real numbers x such that  | d. | Non-negative real numbers x except  | e. | All real numbers
x such that  |
|
|
|
9.
|
Find all real values of x such that f
(x) = 0.

|
|
|
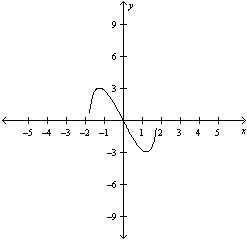
10.
|
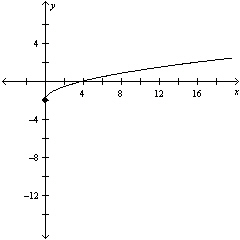
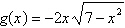
Select the graph of the given function and
determine the interval(s) for which  . .

|
|
|
11.
|
Select the correct graph of the given
function.

|
|
|
12.
|
The cost of sending an overnight package from Los
Angeles to Miami is $ for a package weighing up to but not including
1 pound and $ for a package weighing up to but not including
1 pound and $ for each additional pound or portion of
a pound. A model for the total cost for each additional pound or portion of
a pound. A model for the total cost  (in dollars) of sending the package
is (in dollars) of sending the package
is
     where, where,  is the weight
in pounds. is the weight
in pounds.
Determine the cost of sending a package that weighs  pounds.
|
|
|
13.
|
For following function, select (on the same set of
coordinate axes) a graph for  . 
|
|
|
14.
|
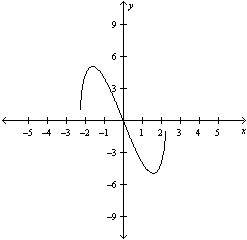
Use the graph of  to write an
equation for the function whose graph is shown. to write an
equation for the function whose graph is shown.
|
|
|
15.
|
Select the graph of  . .

|
|
|
16.
|
Use the viewing window shown to select a possible
equation for the transformation of the parent function.
|
|
|
17.
|
The spread of a contaminant is increasing in a
circular pattern on the surface of a lake. The radius of the contaminant can be modeled by  , where r is the radius in meters and t is the time in hours since
contamination. , where r is the radius in meters and t is the time in hours since
contamination.
Find a function that gives the area A of the circular lake in terms of
the time since the spread began.
|
|
|
18.
|
Use the tables of values for  to complete a table for
  . .
|
|
|
19.
|
Select the graph of the function, and use the
Horizontal Line Test to determine whether the function is one-to-one and so has an inverse
function.
a. |
The function does not
have inverse. | d. |
The function does not
have inverse. | b. |
The function does not have inverse. | e. |
The function does not have inverse. | c. |
The function does not have
inverse. |
|
|
|
20.
|
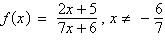
Find the inverse function of
f.
|