Multiple Choice
Identify the
choice that best completes the statement or answers the question.
|
|
|
1.
|
Organize the following data using a line
plot.
17, 8, 17, 14, 11, 18, 8, 11, 14, 18, 8, 17, 11, 14, 8, 14, 17, 11, 18, 17, 14,
17
|
|
|
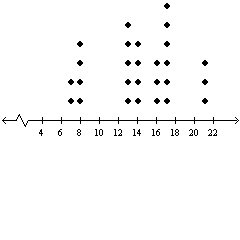
2.
|
A certain data set is organized using the following
line plot.
What is the range of the data
set?
|
|
|
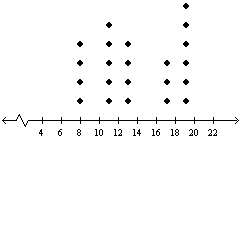
3.
|
Find the data set that was used to produce the
following line plot.
a. | 19, 9, 19, 12, 14, 16, 9, 14, 12, 16, 9, 19, 16, 12, 9,
12, 19, 14, 16, 19, 12, 19 | d. | 19, 9, 19, 12, 14, 16, 9, 14, 12, 14,
9, 19, 14, 12, 9, 12, 19, 14, 16, 19, 12, 19 | b. | 19, 9, 19, 12, 14,
16, 9, 14, 12, 16, 9, 19, 14, 12, 9, 12, 19, 14, 16, 19, 12, 16 | e. | 19, 9, 19, 12, 14,
16, 9, 14, 12, 16, 9, 19, 14, 12, 9, 12, 19, 14, 16, 19, 12, 19 | c. | 19, 9, 19, 12, 14, 16, 12, 14, 12, 16, 9, 19, 14, 12, 9, 12, 19, 14, 16, 19,
12, 19 |
|
|
|
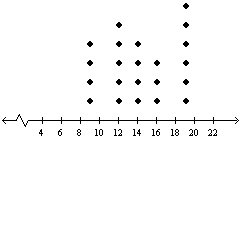
4.
|
A certain data set is organized using the following
line plot.
What is the range of the data
set?
|
|
|
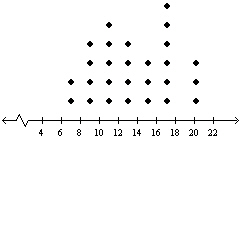
5.
|
Find the data set that was used to produce the
following line plot.
a. | 13, 13, 13, 13, 13, 8, 8, 8, 8, 16, 16, 16, 16, 17, 17,
17, 17, 17, 14, 14, 14, 14, 7, 7, 21, 21, 21 | d. | 13,
13, 13, 13, 8, 8, 8, 8, 8, 16, 16, 16, 17, 17, 17, 17, 17, 17, 14, 14, 14, 14, 7, 7, 21, 21,
21 | b. | 13, 13, 13, 13, 13, 8, 8, 8, 8, 16, 16, 16, 17, 17, 17,
17, 17, 17, 17, 14, 14, 14, 7, 7, 21, 21, 21 | e. | 13, 13, 13, 13,
13, 8, 8, 8, 8, 16, 16, 16, 17, 17, 17, 17, 17, 17, 14, 14, 14, 7, 7, 7, 21, 21,
21 | c. | 13, 13, 13, 13, 13, 8, 8, 8, 8, 16, 16, 16, 17, 17, 17,
17, 17, 17, 14, 14, 14, 14, 7, 7, 21, 21, 21 |
|
|
|
6.
|
Organize the following data using a stem-and-leaf
plot.
13, 2, 35, 5, 16, 39, 42, 7, 33, 25, 3, 14, 47
|
|
|
7.
|
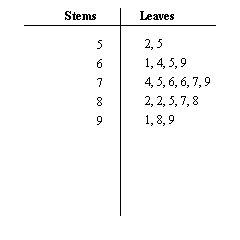
The following stem-and-leaf plot was used to
organize a group of test scores. How many students had a test score higher than 70?
|
|
|
8.
|
Find the median of the following set of
measurements.
3, 2, 10, 13, 9, 23, 15, 3, 25
|
|
|
9.
|
Jasmine is in the checkout line of a grocery
store. Her basket contains 3 bags of chips at a price of $3.24 per bag, 8 jars of peanut butter
at $2.53 per jar, 10 frozen pizzas at $4.23 per pizza, and 4 candy bars at $1.46 per bar. Find
the mean price of all the items in her basket.
a. | $2.53 | d. | $3.12 | b. | $3.24 | e. | $2.99 | c. | $4.23 |
|
|
|
10.
|
A certain restaurant hosted a series of birthday
parties throughout the month. If the number of attendees at each party is listed below, find
the median number of attendees for the
month.
127
79
88
55
106
118
51
123
|
|
|
11.
|
Find the variance of the following data
set.
6, 2, 11, 13, 7, 20, 17, 11
a. | 11 | d. | 5.51 | b. | 10.875 | e. | 31.433 | c. | 30.359 |
|
|
|
12.
|
Find the standard deviation of the following data
set.
6, 1, 11, 12, 9, 19, 16, 11
a. | 5.219 | d. | 27.234 | b. | 4.102 | e. | 10.625 | c. | 11 |
|
|
|
13.
|
A certain restaurant hosted a series of birthday
parties throughout the month. If the number of attendees at each party is listed below, find
the standard deviation of the data
set.
121
73
81
53
101
117
57
124
a. | 723.609 | d. | 23.352 | b. | 90.875 | e. | 26.9 | c. | 21.59 |
|
|
|
14.
|
Find the variance and standard deviation of the
following data set.
4, 1, 11, 16
a. | variance: 33.849
standard deviation:
5.874 | d. | variance: 34.500
standard deviation:
5.874 | b. | variance: 34.500
standard deviation:
5.818 | e. | variance: 36.092
standard deviation: 6.008 | c. | variance: 33.849
standard deviation:
5.818 |
|
|
|
15.
|
Find the upper quartile of the following set of
data.
21, 28, 19, 27, 44, 35, 11, 32, 50, 42, 17, 39
|
|
|
16.
|
Find the sum of square differences between the data
below and the corresponding least-squares regression line.
(3, 5), (7, 3), (10, 10), (11,
19)
a. | 65.861 | d. | 67.082 | b. | 64.06 | e. | 65.187 | c. | 15.51 |
|
|
|
17.
|
Find the sum of square differences between the data
below and the corresponding least-squares regression line.
(–4, 6), (–1, 3), (7,
6), (9, –3), (12, –9)
a. | 74.748 | d. | 14.268 | b. | 72.535 | e. | 76.084 | c. | 74.077 |
|
|
|
18.
|
Find the least squares regression parabola for the
points.
( , –3), ( , –3), ( , 0), (0,
–2), (1, 0) , 0), (0,
–2), (1, 0)
|
|
|
19.
|
A certain town conducted a survey to find out the
average grocery bill of families of various sizes. Some of the compiled data is shown
below.
| Family Size, x | 1 | 2 | 3 | 4 | | Weekly Grocery Bill (in $’s), y | 90 | 149 | 180 | 231 | | | | | |
Estimate the
weekly grocery bill for a family of size 7 using the least squares regression line for the
data.
a. | $369.36 | d. | $365.53 | b. | $368.05 | e. | $366.80 | c. | $370.12 |
|
|
|
20.
|
A certain town conducted a survey to find out the
average square footage of houses for families of various sizes. Some of the compiled data is
shown below.
| Family Size, x | 1 | 2 | 3 | 4 | | Square Feet, y | 945 | 1023 | 1249 | 1439 | | | | | |
Estimate the average square footage in
a house for a family of size 7 using the least squares regression line for the
data.
a. | 1929.6 feet | d. | 1936.6
feet | b. | 1927.6 feet | e. | 1924.6
feet | c. | 1932.6 feet |
|